

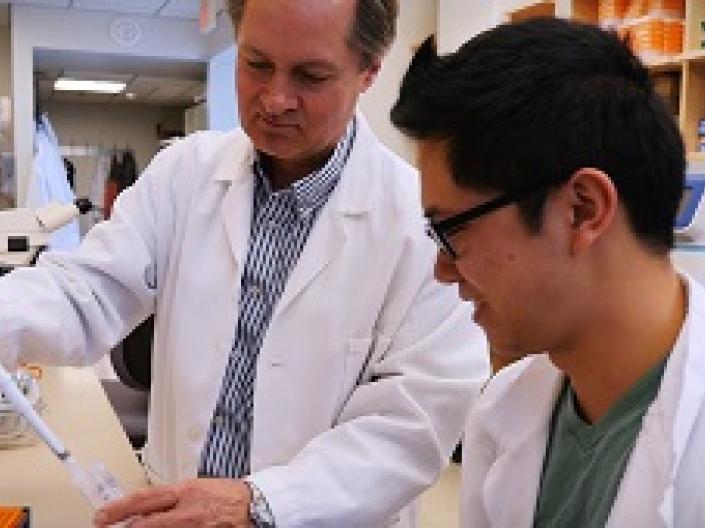
Education
Our MS program, PhD program, residency and clinical fellowships offer rigorous training in research, anatomic pathology and clinical pathology within a large, thriving academic medical center. The faculty members of the department are enthusiastic teachers committed to world-class pathology education.
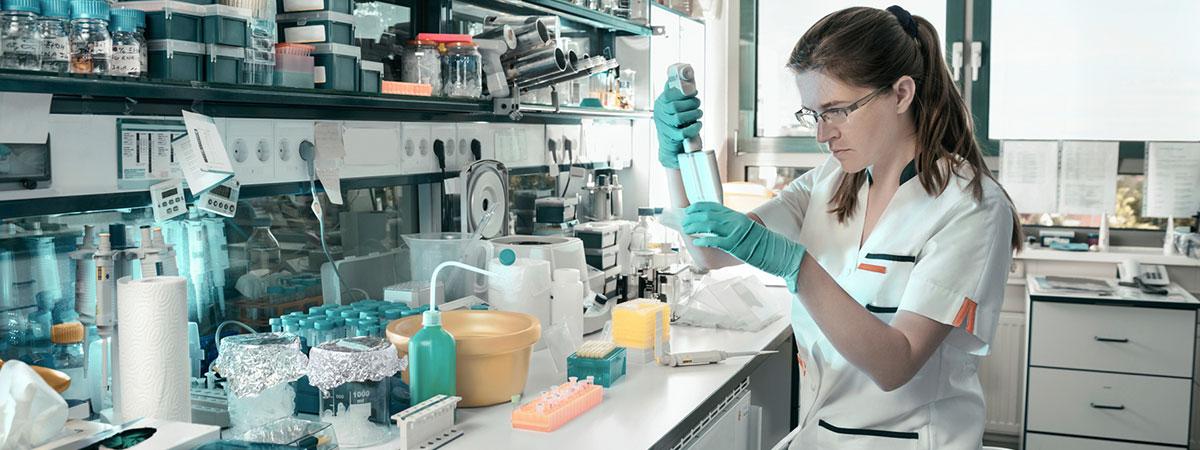
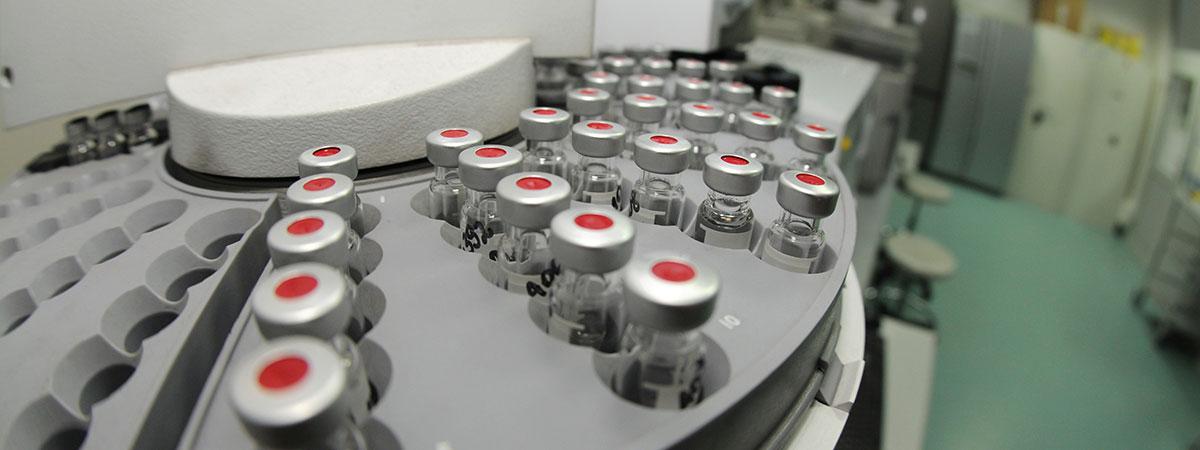
Research
The Department of Pathology performs cutting edge research in Cancer Biology, Immunology, Neuropathology and many other areas.

News and Events
See the latest news and events pertaining to the Department of Pathology.